Ask your projects data anything. Get answers in seconds. Plexa MCP Connector is live. See it in action
/
Analytics & Reporting
Construction reporting software that builds the report for you
Live project analytics across cost, programme, quality, safety and procurement. Monthly board reports generated in seconds, not days.

Live project dashboards
Cost, programme, quality, safety and procurement, always current.
Portfolio in one view
Every project's status side by side, with exception flags on what needs attention.
AI narrative in seconds
Plexa reads the numbers and writes the "what changed this week" paragraph for you.

THE PROBLEM
An enterprise builder spends an average of 4 hours per project per week building the weekly report by hand.
Cost from Jobpac. Safety from HammerTech. Programme from Primavera. Defects from a spreadsheet. Correspondence from Outlook. The PM's weekly report is a copy-paste job across five systems, and the numbers rarely agree.
Plexa runs analytics off the one live data model. The report is a view, not a rebuild.
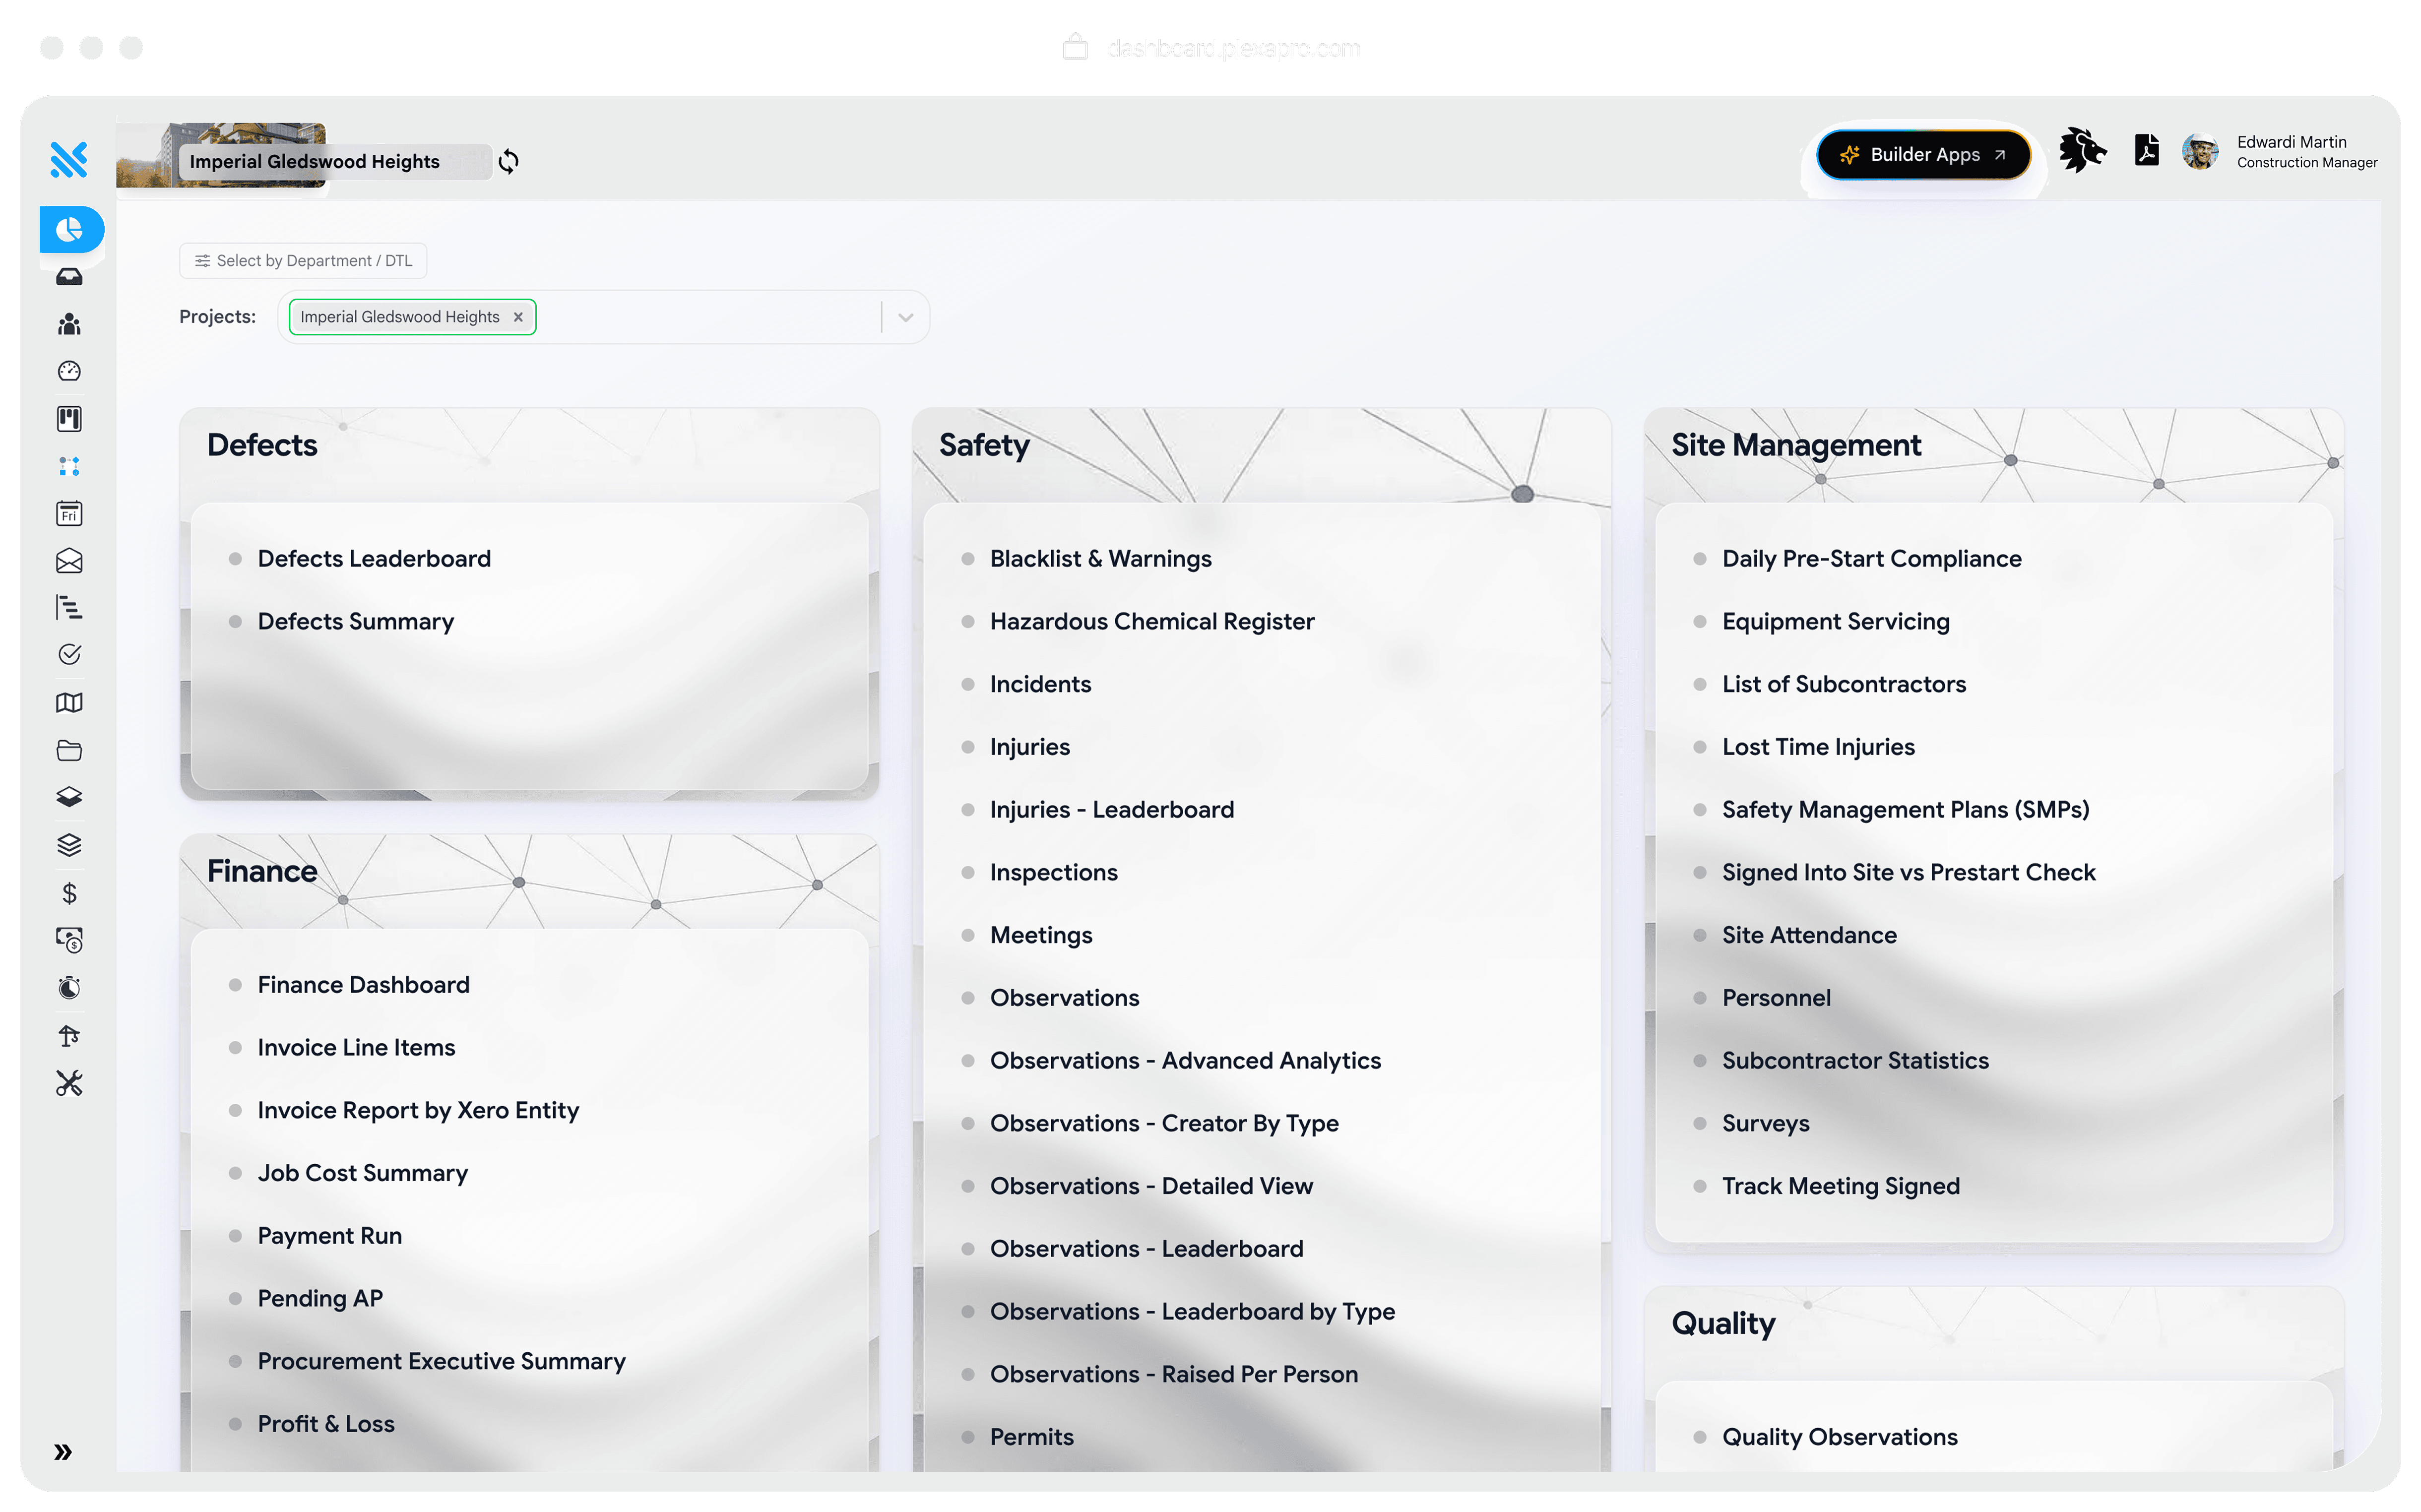
Executive portfolio dashboard for every project you're running
One screen. Every active project. Cost variance, programme slippage, safety incidents, defect trend. The board meeting narrative writes itself.
FAQ
Quick answers: everything you need to know about analytics and reporting in Plexa
What is construction reporting software?
What metrics can Plexa report on?
Can we build a custom report for our board?
Does Plexa integrate with Power BI?
What does the AI narrative feature do?
Can we export reports to PDF or PowerPoint?


The AI Construction Operating System
One platform, one data model, every project. Built in Australia, for the world.
YOUR DATA, PROTECTED
Hosted on AWS Sydney with Australian data residency.


GET THE MOBILE APP
Platform
Solutions
© 2026 Plexa Pro Pty Ltd. ABN 63 668 433 136