Ask your projects data anything. Get answers in seconds. Plexa MCP Connector is live. See it in action


Why Construction Profit Margins are Tighter than they Should Be
Construction's cost blow-outs aren't always about materials or labour. A growing body of research points to a leak that's far less visible: in how firms manage cost information itself.
Picture a project manager on a Monday morning. Before they've had their first coffee, they're already buried in a spreadsheet, copying figures from one tab to another, cross-referencing a subcontractor's invoice against a forecast that was last updated three weeks ago.
By the time the numbers make sense, two hours have gone. The site is already running.
This isn't a rare scene. It plays out on construction projects across Australia every single day. And according to recent research into digital transformation and cost management in construction, it's one of the industry's most quietly damaging habits.
Not just because of the time it eats up, but because of the compounding errors, missed signals and reactive decisions that manual processes produce further down the track.
An industry that built everything except its own systems
Construction has always been extraordinary at the physical work. Designing complex structures, coordinating hundreds of trades, delivering projects worth billions of dollars.
But when it comes to managing the data behind those projects, the sector has historically punched well below its weight. Despite construction contributing enormously to national economies, it has consistently lagged other industries in adopting new technology. Manufacturing, logistics, even agriculture have digitised their core workflows faster.
Construction has, for the most part, kept reaching for the same tools it's used for decades.
"The real advantage will belong to the organisations that pair technology with leadership, curiosity and conviction. In a market shaped by risk, scarcity and rising expectations, the future will not reward hesitation."
Hubexo. (2025). Construction Outlook 2026: Australia. Hubexo Market Intelligence. Published December 2025.
The reasons aren't hard to find. Projects are fragmented and temporary. Every job is different. Supply chains are complex.
And when you're on-site trying to get a slab poured before rain hits, a new software platform is the last thing anyone wants to think about. That reluctance is understandable. But it's becoming increasingly costly.
20% reduction in wasted effort when BIM integrates with automated systems1 | 15% average productivity gain from digital transformation in engineering1 | 10–15%
|
The visibility gap: where margin actually disappears
Here is the problem that most firms don't talk about openly. A cost issue doesn't announce itself. It starts small, quietly, often in the middle of a busy week on site. A subcontractor scope creeps. An untracked variation gets absorbed. Labour runs a little long on a task that was already tight.
None of it shows up in the system yet. Because there isn't really one system. There are five.
The budget lives in a spreadsheet on the quantity surveyor's desktop. The programme is in one scheduling tool, last updated on Thursday. The invoices are sitting in the accounting software, waiting to be matched. The site supervisor is logging progress in a separate app that doesn't talk to any of the others. And the subcontractor correspondence is buried in an email thread that three different people are cc'd on but nobody owns.
Each of those tools is doing its job in isolation. None of them are talking to each other. And so nobody, at any given moment, has a complete picture of where the project actually stands financially.
That's the real issue. It's not that firms don't have data. It's that the data lives in too many places, updated at different times, by different people, with no single version of the truth connecting them. Information that should flow automatically instead gets moved manually, if it gets moved at all.
By the time the overrun surfaces in a report, weeks have passed. The concrete is poured. The trade has moved on. The variation window has closed. What could have been a conversation in week one is now a dispute in week six.
The diagram below tells this story in one glance. Two parallel tracks: what is happening on site, and what the reporting system knows about it. The red zone in the middle is the gap. That is where the margin goes.
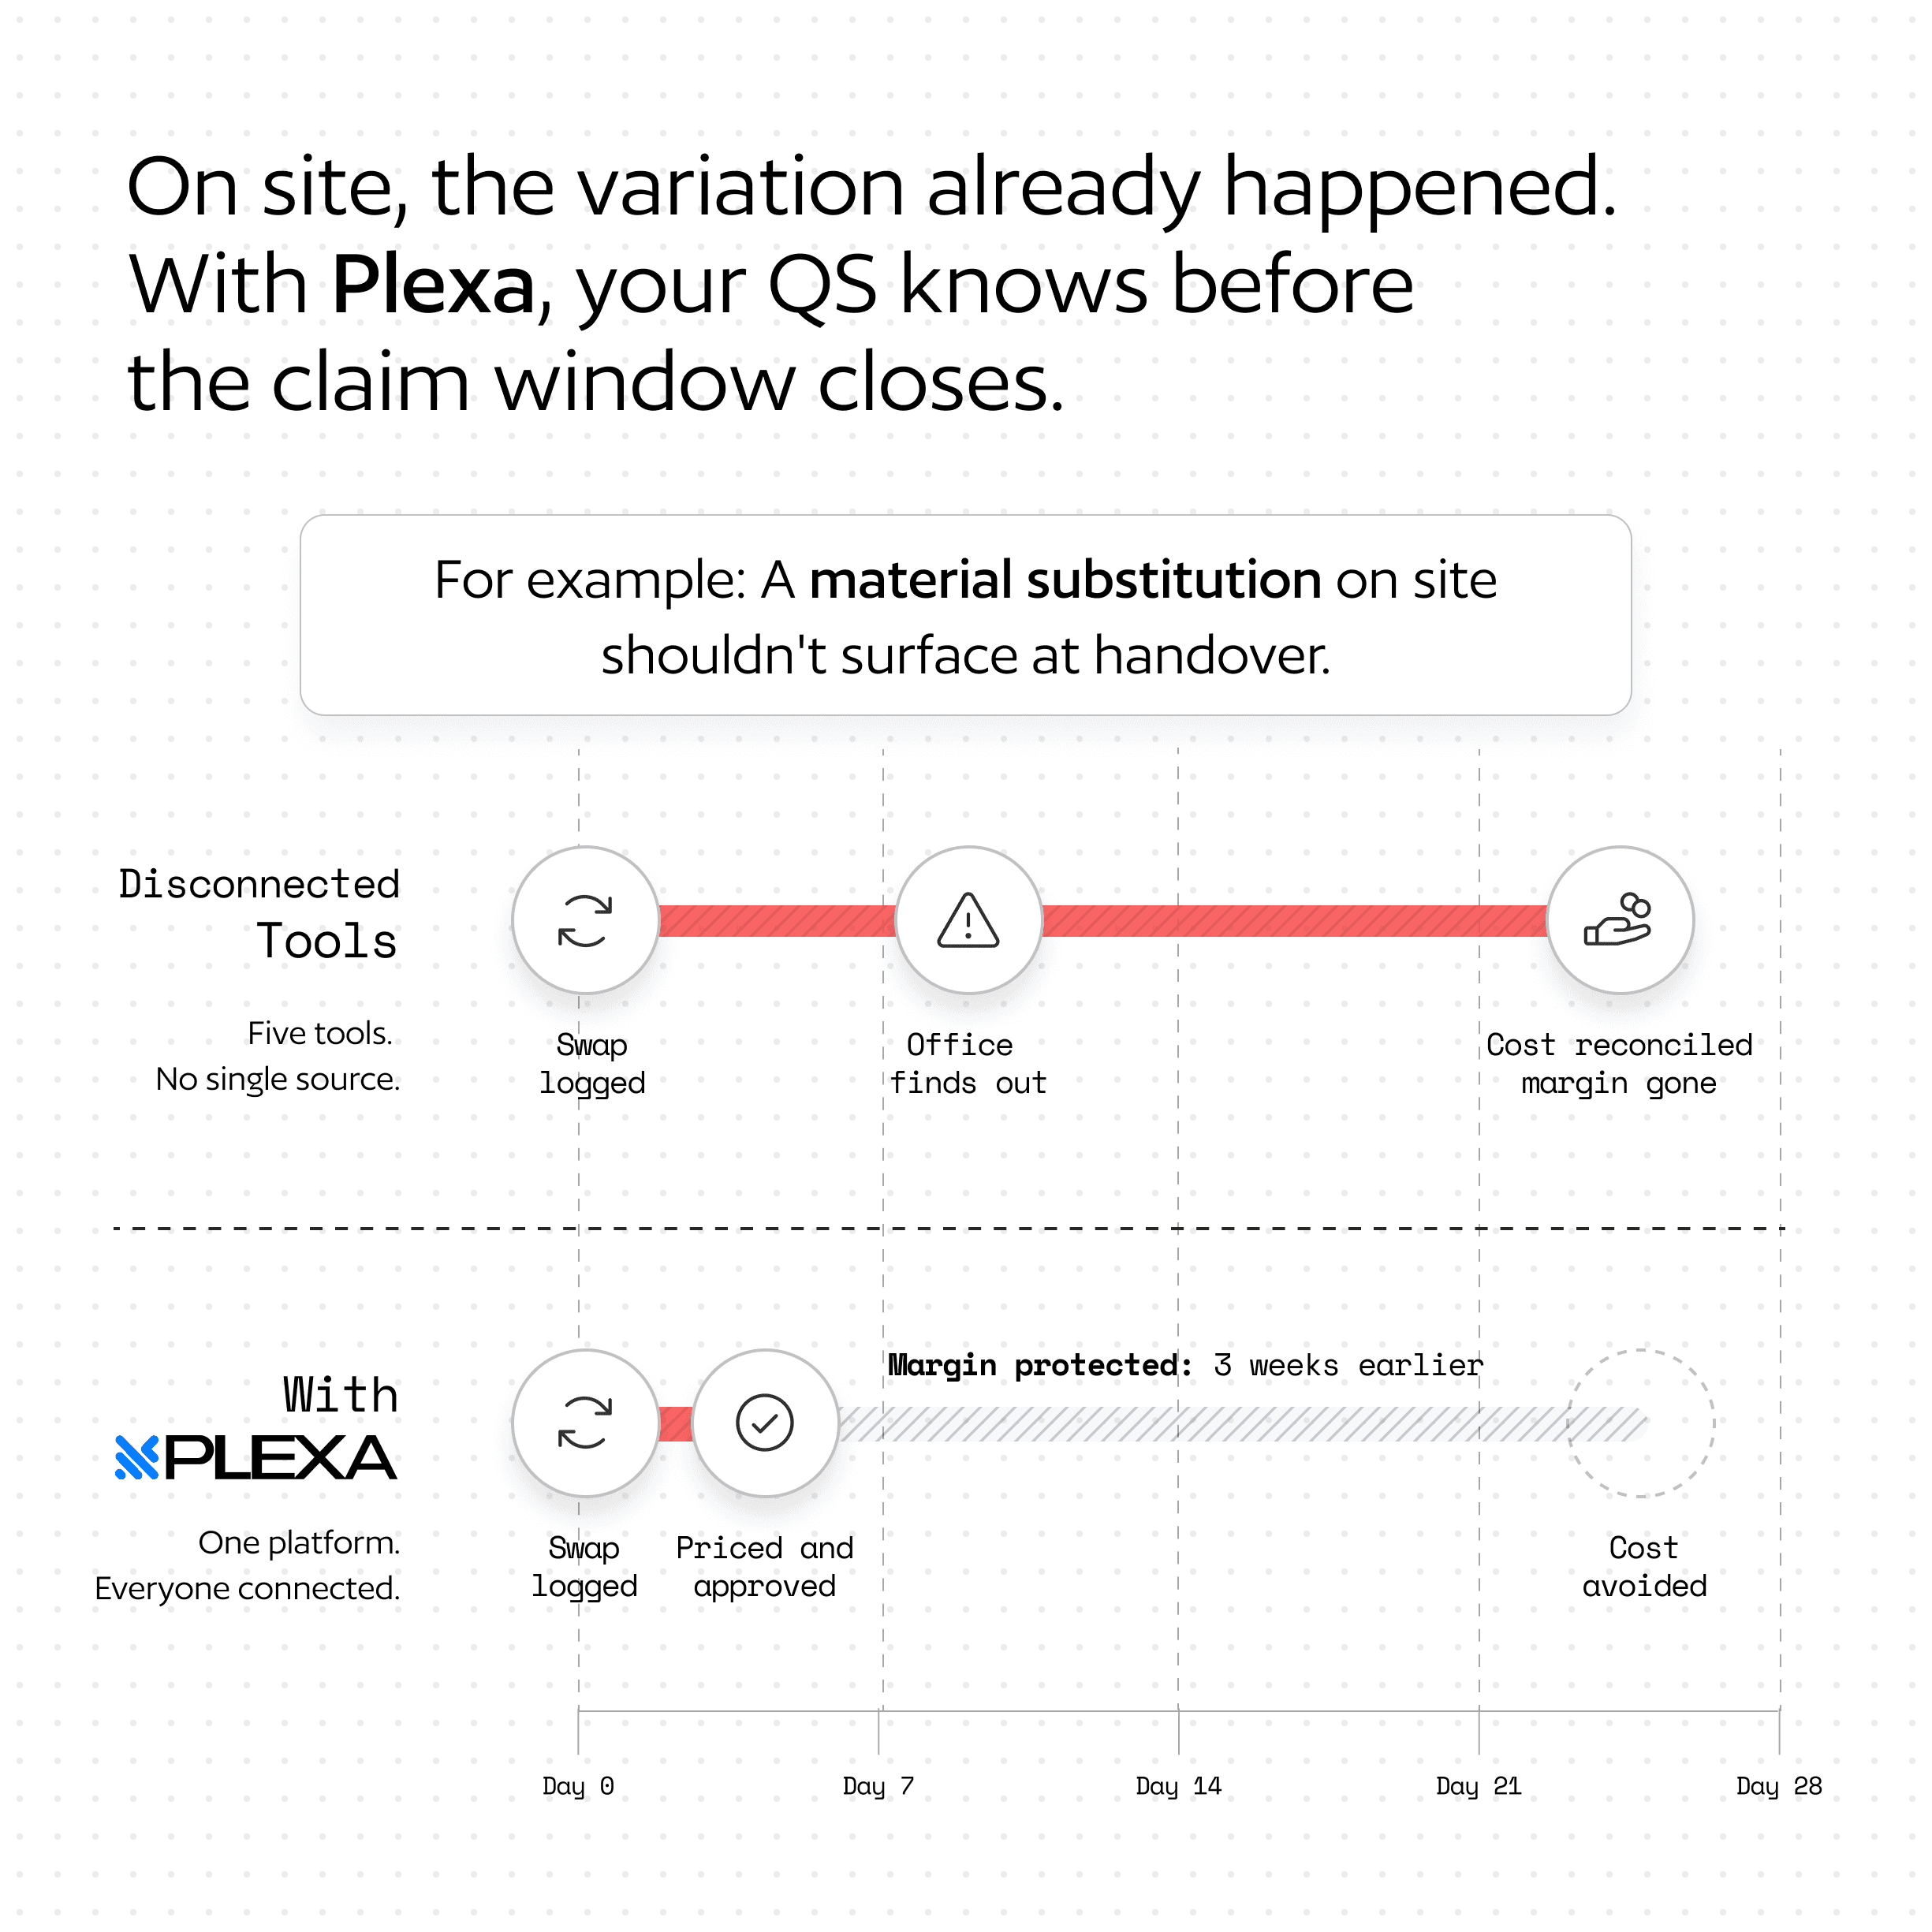
Closing that gap is not about working harder or updating spreadsheets more often. It's about replacing a collection of disconnected tools with a connected system, so the information flows in real time, without anyone having to manually carry it from one place to another.
Where the margin actually goes: a project-level breakdown
The visibility gap explains the mechanism. But it helps to see the actual scale of what gets lost, and where.
On a typical Australian construction project, a 15% gross margin sounds like a reasonable starting point. The benchmark range for construction in Australia sits between 15 and 35%, so 15% is the floor, not a target.2 But watch what happens to it over the course of a project.
Labour overruns chip away first. Then untracked variations. Rework from miscommunication or outdated plans. Payment disputes that drag out and tie up cash. And finally, the quiet cost that nobody puts a number on: the admin overhead of running cost management manually across multiple tools, multiple people and multiple versions of a spreadsheet.
By the time you add those up, a 15% gross margin can land at 5% net. On a $20 million project, that's $2 million in margin. Ten points of it, gone.
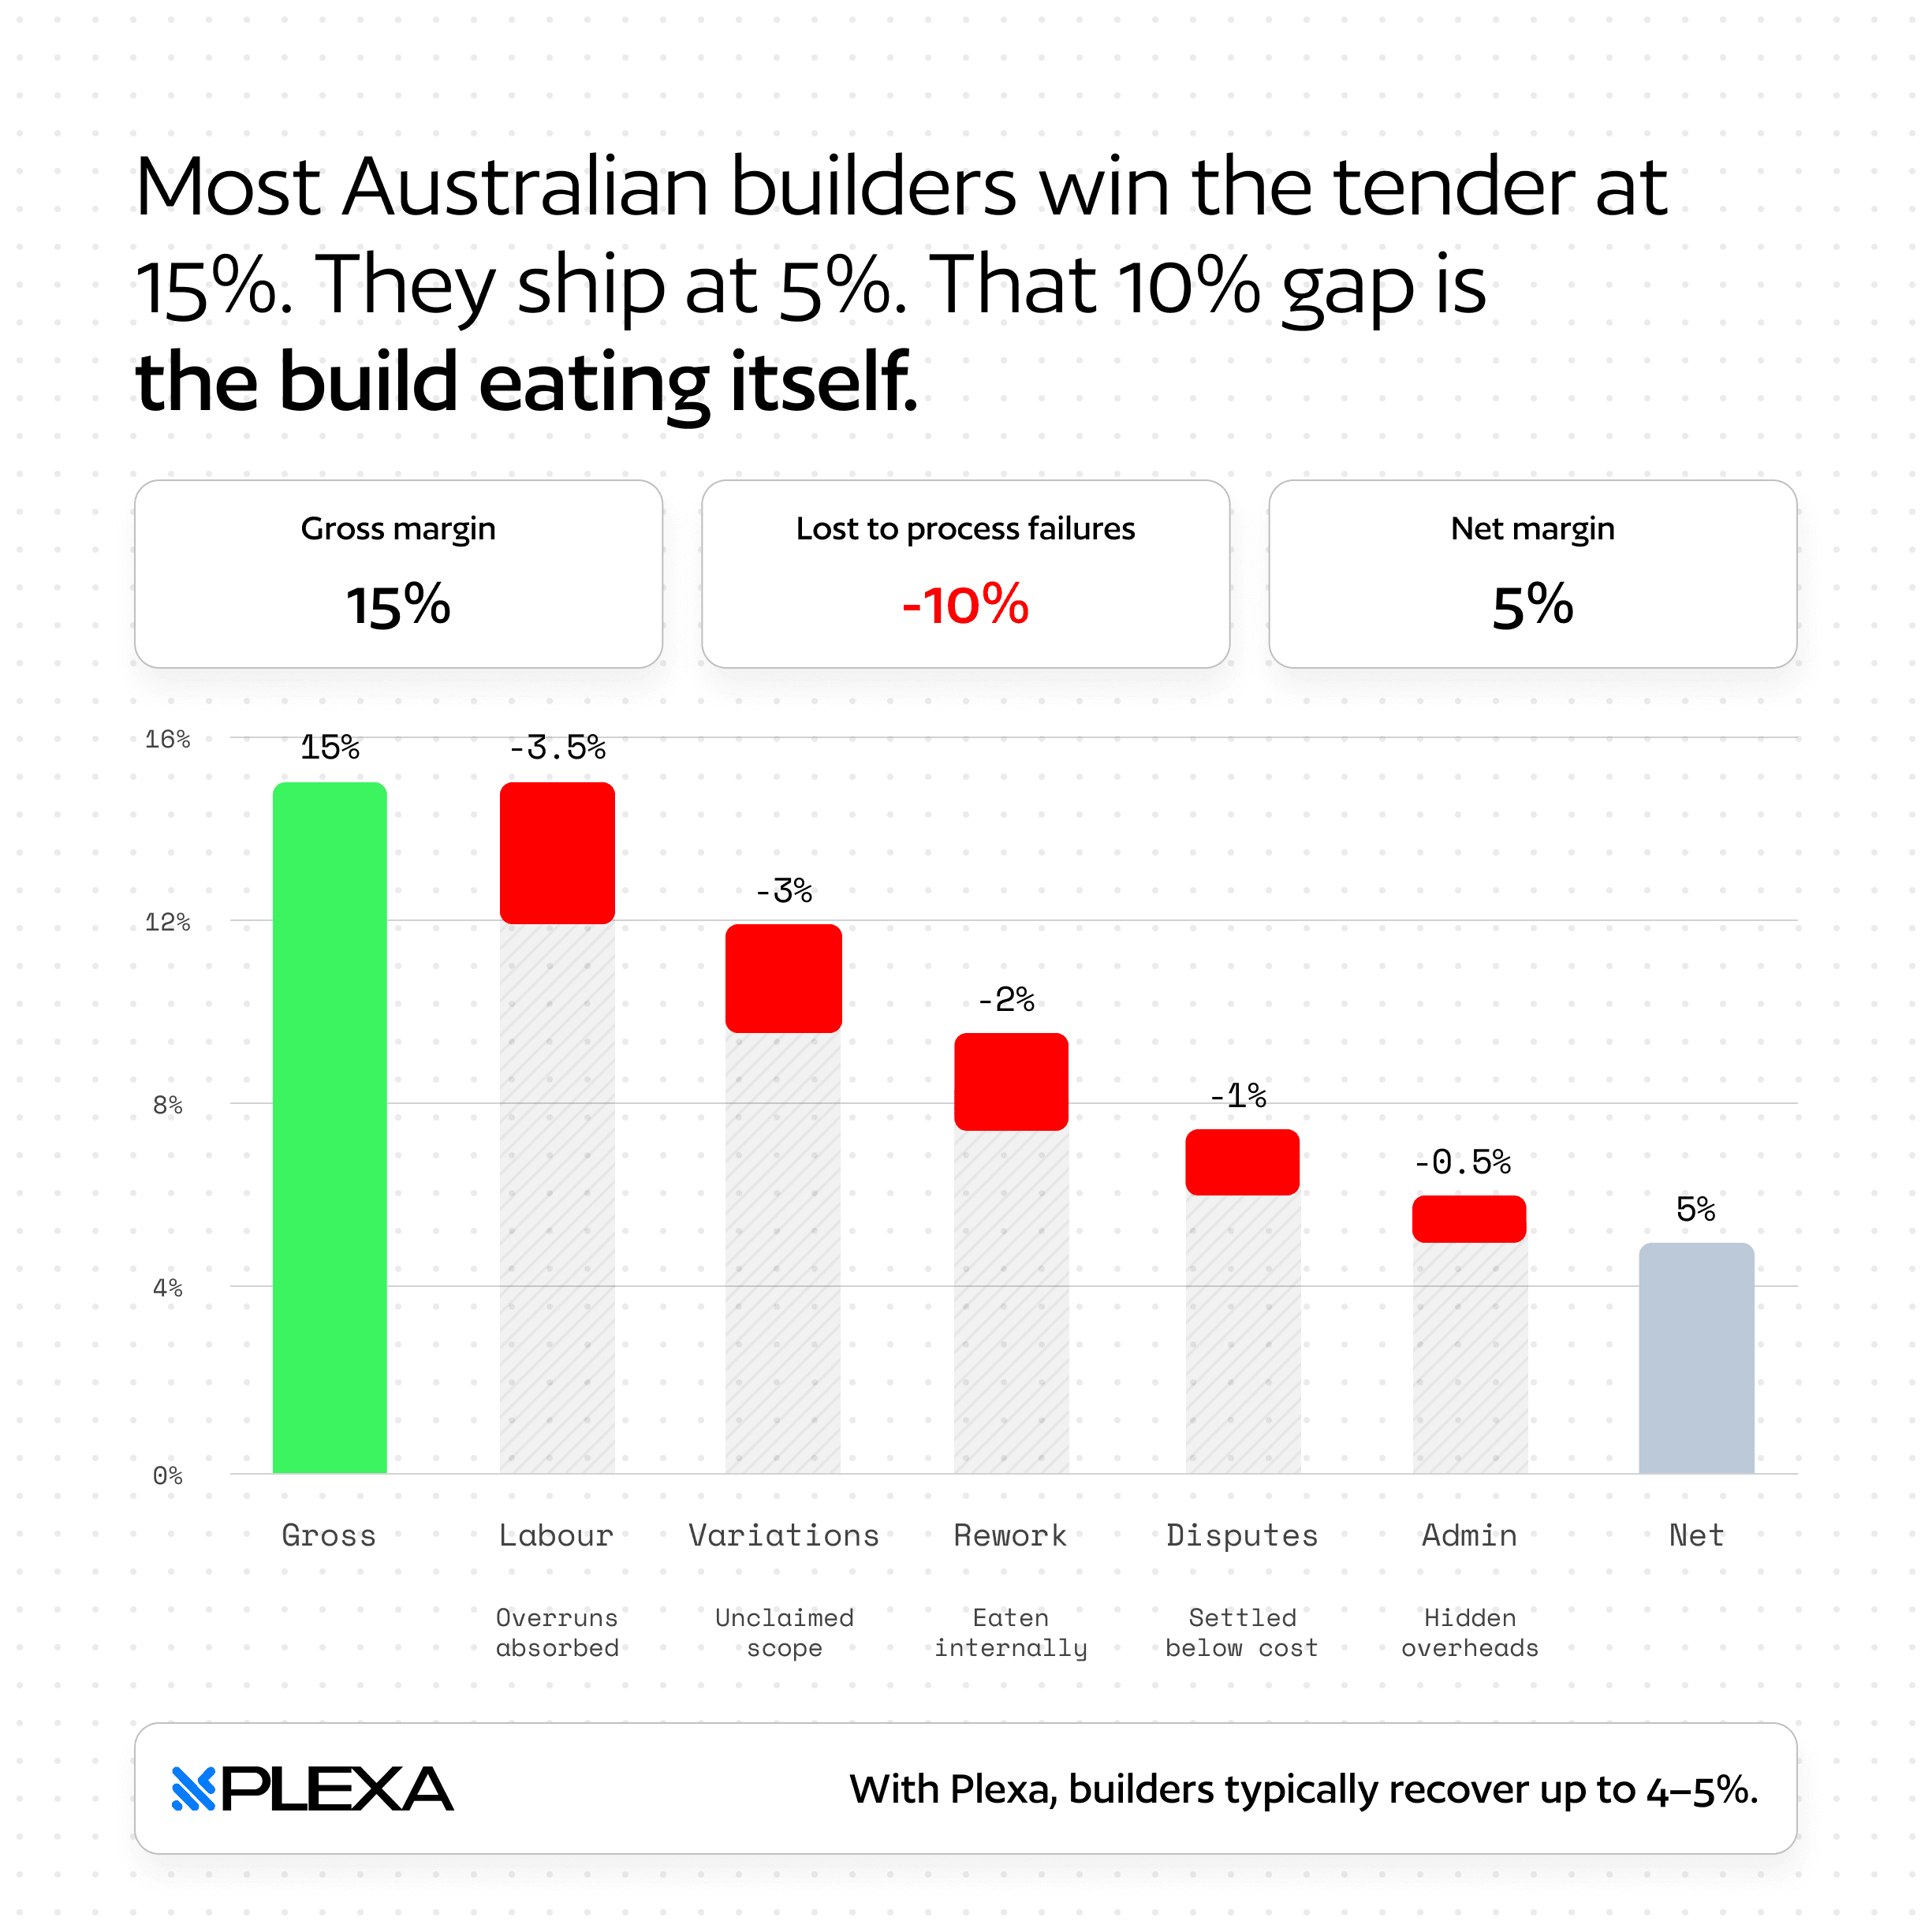
What makes this particularly confronting is that most of those losses are not inevitable. They are the product of information arriving too late, living in the wrong place, or never being connected in the first place.
Labour overruns that get caught in week two cost a fraction of what they cost in week six. Variations that are tracked in real time don't become disputes. Rework drops significantly when teams are working from a single, current version of the plan rather than whatever was emailed last Thursday.
The waterfall is not a portrait of a bad project. It's a portrait of a normal project running on manual systems.
What "good" actually looks like
Research into automation and digital tools in construction cost management paints a pretty clear picture of what firms gain when they make the shift. And it goes well beyond saving a couple of hours on spreadsheets each week.
The first and most immediate benefit is accuracy. When cost data flows automatically from procurement through to forecasting, the number of human touch-points drops. So does the number of opportunities for error.
That matters a lot in an environment where a mis-keyed figure in a variation can snowball into a six-figure dispute months down the line.
The second benefit is visibility. Automated cost management surfaces the right information at the right time: budget burn by trade, forecast-to-actual variances, subcontractor payment status. Project managers stop spending their mornings chasing data and start spending them acting on it.
What automation actually changes in cost management1
Real-time visibility into budget burn and variance, without manual reconciliation
Automated flagging of cost overruns before they compound into larger issues
Streamlined progress claims and invoice matching against approved scopes
Connected data from procurement through to forecasting in a single workflow
Audit trails and compliance documentation generated automatically
Fewer disputes through clearer, faster communication of financial status
The third benefit is prediction. Good platforms don't just report what has already happened. They help teams anticipate what is likely to happen next.
Which subcontractors are trending over budget. Where schedule pressure is likely to generate cost variation. How the current burn rate maps against program milestones. That kind of foresight used to come from years of experience. Automation is making it accessible to the whole team.1
The Australian context makes this more urgent
If there was ever a moment for Australian construction firms to sharpen their cost management capabilities, it's now.
The industry is navigating sustained pressure on multiple fronts. Construction costs have risen sharply, skilled labour is still hard to find, and supply chain disruptions have made procurement forecasting harder than it's been in years.
Australia's top 50 builders collectively commenced construction on over $33 billion worth of projects last year. At that scale, even modest improvements in cost management efficiency translate into significant value recovered.
And the margin for error is thinning. Interest rate sensitivity, tighter lending conditions and more demanding clients mean that overruns that might once have been absorbed quietly are now genuine risks to project viability.
Builders are already feeling this shift. The move from reactive to predictive thinking is showing up in how leading firms approach site monitoring, procurement sequencing and risk profiling.
Digital systems are becoming the mechanism through which transparency gets delivered, not just to project teams, but to the lenders and capital partners who increasingly want visibility into financial risk before they'll commit to the next funding milestone.
The cultural piece everyone glosses over
There's a pattern in how digital transformation conversations tend to go in construction. The technology gets most of the attention. The people side of it gets very little.
That's a problem, because the research is pretty consistent: the barriers to digital adoption in construction are just as much about culture as they are about technology.
Teams that have built their workflows around familiar tools, whether that's a spreadsheet, an email thread or a particular way of running a monthly cost report, don't abandon them easily. And not just out of stubbornness.
Those workflows often encode real institutional knowledge about how a business runs. The risk isn't just that people won't use a new platform. It's that the tool gets implemented without genuine buy-in and ends up being used in the narrowest possible way, which is basically just a more expensive spreadsheet.
The firms that get this right tend to do a few things differently. They explain the "why" before the "how." They involve cost managers and project engineers early in the platform selection process, rather than presenting a done deal.
And they treat the early wins, like the first automated cost report or the first variation caught before it became a claim, as evidence worth sharing across the business.
The real question isn't whether your business can afford to invest in better cost management tools. It's whether it can afford not to.
Shinde, R. (2025). Digital Transformation in Construction Engineering Cost Management: Leveraging Automation for Operational and Competitive Advantage. ResearchGate. www.researchgate.net/publication/398619950
Where Plexa fits into this
The research on digital transformation in construction isn't describing some distant future state. It's describing a present that is already sorting firms into two groups.
Those who have real visibility and control over their project finances, and those who are finding out too late that something has gone wrong.
Plexa was built for the firms who want to be in the first group. The ones who know where every dollar is going, who can close out a project without a financial reckoning, and who can walk into a client or lender meeting with actual data behind them rather than a best estimate.
That doesn't require ripping out everything that exists and starting from scratch. It starts with connecting the cost data that's already being generated, from subcontractor claims, purchase orders, variations and forecasts, into a system that surfaces what matters, to the people who need to act on it, when they need to act.
That project manager on Monday morning shouldn't be spending their first two hours in a spreadsheet. They should be on-site, with the numbers already in front of them before they get there.
Sources
1. Shinde, R. (2025). Digital Transformation in Construction Engineering Cost Management: Leveraging Automation for Operational and Competitive Advantage. ResearchGate. researchgate.net/publication/398619950
2. Hubexo. (2025). Construction Outlook 2026: Australia. Hubexo Market Intelligence. Published December 2025.


Privacy policy . Cookie policy © 2026 - Plexa